There are many ways to communicate a pattern – written pattern, charts, video tutorials, or just passed down from one person to another verbally. I think the most common way is a written pattern.
But, written patterns have a lot of flaws. Our language is not precise when it comes to crochet. I’ve mentioned this problem before with regard to yarn and hooks but the problem is even more obvious when it comes to patterns. A double crochet in the US is not the same as a double crochet in the UK, so you need to know which terms are being used by the patterns.
Even more confusing, many stitches don’t have standardized names. A lot of people use the terms popcorn, puff, and bobble stitches interchangeably, even though they are three different stitches.
This is why I love charts. Charts have no language, except maybe in the legend. But, that’s really unnecessary because the symbols are universal. So you can pick up a chart made in Japanese and still be able to follow along. Most of the time, you can presume US Terms, but in a UK pattern, the symbols are in UK Terms.
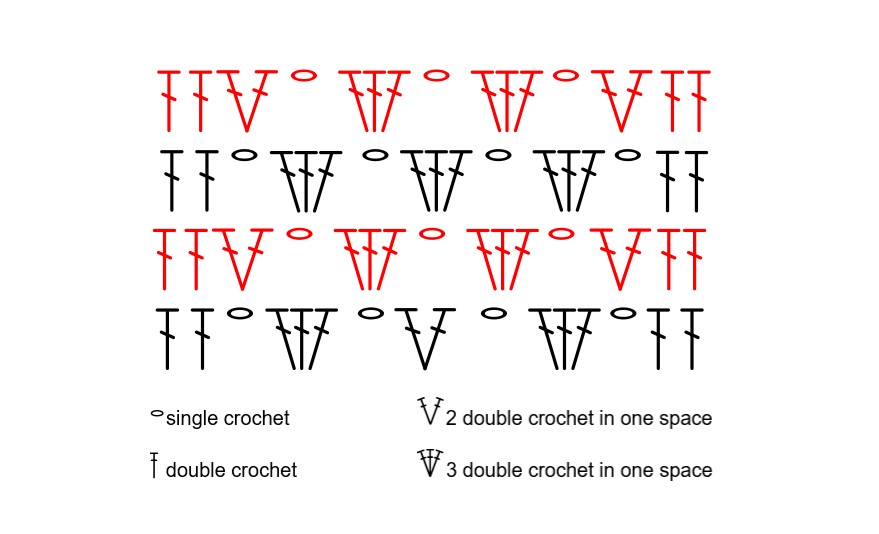
I’ve made a simple little chart here to help demonstrate how easy charts can be. This is for a simple granny stitch row, with two double crochets on each end.

The first thing you may notice is that there are two different colors. One is black and one is red. Black is pretty much the standard used to indicate right side and wrong side is frequently represented by red, blue or grey. It’s pretty easy to figure out for the most part.
Somewhere on most charts is a legend, which indicates which symbol represents each stitch. Mine is below, but sometimes it’s in a box on the side, or the top even.
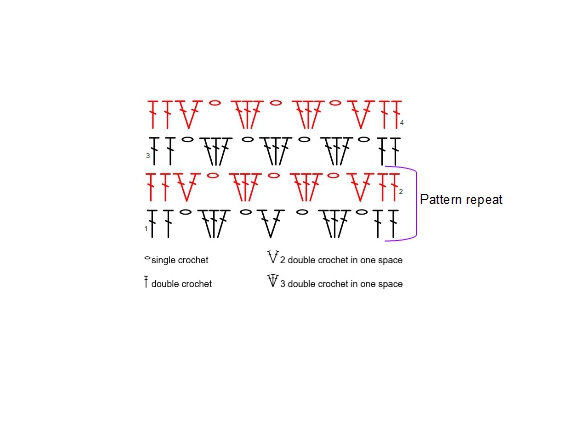
Sometimes charts have numbers for the rows, sometimes not. Frequently you will see something small like this, which is representative of the whole pattern and not the entire pattern. There might be rows above and below that are not included in the chart, such as your first row of double crochets or something along those lines.

In this image, I’ve put a bracket around the pattern repeat so you can see it’s a two row repeat. I’ve also added numbers, so you can clearly see odd rows are black, and even rows are red.
Starting with row 1, you see two elongated Ts with a hash mark across them. In the legend, you can see that represents a double crochet. Here’s a little hint – the hash marks represent each time you wrap the yarn around your hook. One hash mark = one wrap before you pull up a loop = double crochet. Two hash marks = two wraps before you pull up a loop = treble crochet. And so on. There are no stitches below those first two stitches so you can assume that they go in the first two stitches.
The next stitch is a chain, which would correspond with skipping a stitch in the row below if we could see it.
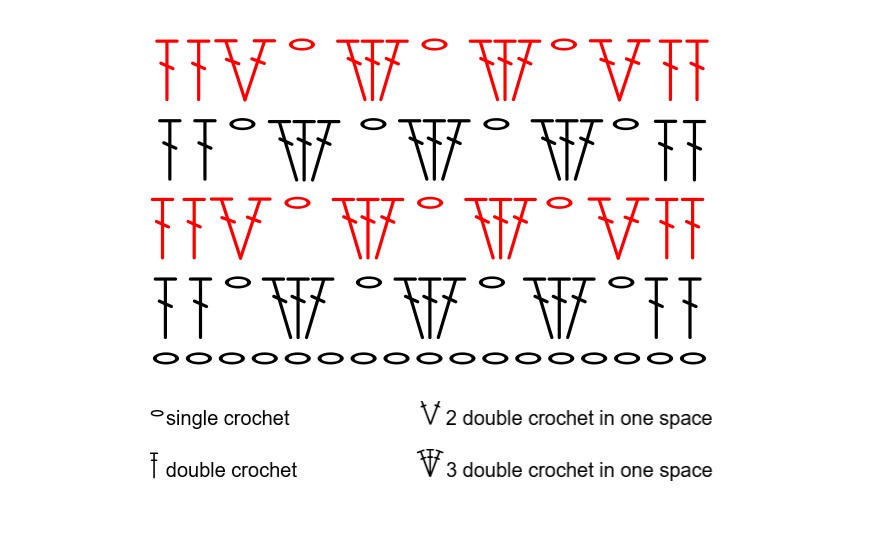
The next stitch is a bit more confusing. In the legend, you see that it’s 3 double crochets in one stitch. To make things easier, I added a row of single crochets below so you can see where the stitches end up going. In my opinion, this is where charts really shine!

You can see that the 3 double crochets in one stitch lines up with a single crochet below. So you know exactly where to place those stitches. It is very hard to express this in worded patterns, especially with more complex patterns. I love the visual representation that charts provide!
After the 2 double crochets together is a chain stitch, and then you simply repeat that until the end, where you finish with 2 double crochets.
In subsequent rows, rather than place your 3 double crochets together in a starting chain, they will go around the chain space.
This is a very simple repeat, one that is very common in basic crochet patterns. It can be in rows or granny squares, but you will see this repeated over and over.
Feel free to test it out and see if you can follow along with no words. I plan to include a chart with all of my patterns as I find them easier to read and follow along with. When patterns get too wordy, my head scrambles things a bit, and the visual representation helps me a lot. My favorite patterns include both words and charts so I can refer back and forth to understand exactly what to do.
Which do you like better? Charts or words? And why?
